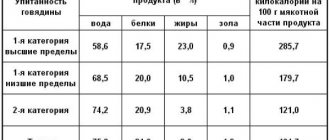
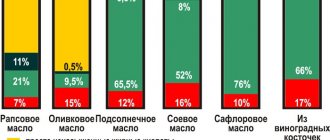
This table of calories and content of proteins, fats, carbohydrates and water contains the most complete number of products. The nutritional value and nutritional value of all products is indicated per 100 grams of product. But let me remind you that it is best to look at the energy value of products on their packaging; use the table only if it is not possible to find out the calorie content from the product packaging. Knowing the calorie content of foods is necessary in order to correctly count calories for weight loss (you can read about this in our article How to correctly count calories to lose weight).
Caloric content of products is given in raw form, unless otherwise noted. For example, you need to take into account that if buckwheat in its raw form has a calorie content of 329 kcal, then when cooked, the calorie content will decrease. For example, if you add 300 grams of water to 100 grams of cereal, the calorie content of the finished dish will be only 82 kcal.
To quickly search for a product in the table, press CTRL + F at the same time, and in the search window that appears, enter the product name.
Milk and dairy products
| Product | Water, g | Proteins, g | Fats, g | Carbohydrates, g | Calorie content, kcal per 100 g |
| Brynza | 52,0 | 17,9 | 20,1 | 0,0 | 260 |
| Yogurt 1.5% fat | 88,0 | 5,0 | 1,5 | 3,5 | 51 |
| Kefir 0% fat | 91,4 | 3,0 | 0,1 | 3,8 | 30 |
| Kefir 3.2% fat content | 88,3 | 2,8 | 3,2 | 4,1 | 59 |
| Milk 3.2% fat | 88,5 | 2,8 | 3,2 | 4,7 | 58 |
| Whole milk powder | 4,0 | 25,6 | 25,0 | 39,4 | 475 |
| Condensed milk with sugar | 26,5 | 7,2 | 8,5 | 56,0 | 315 |
| Curdled milk | 88,4 | 2,8 | 3,2 | 4,1 | 58 |
| Ryazhenka | 85,3 | 3,0 | 6,0 | 4,1 | 85 |
| Cream 10% | 82,2 | 3,0 | 10,0 | 4,0 | 118 |
| Cream 20% | 72,9 | 2,8 | 20,0 | 3,6 | 205 |
| Sour cream 10% | 82,7 | 3,0 | 10,0 | 2,9 | 116 |
| Sour cream 20% | 72,7 | 2,8 | 20,0 | 3,2 | 206 |
| Special cheeses and curd mass | 41,0 | 7,1 | 23,0 | 27,5 | 340 |
| Russian cheese | 40,0 | 23,4 | 30,0 | 0,0 | 371 |
| Dutch cheese | 38,8 | 26,8 | 27,3 | 0,0 | 361 |
| Swiss cheese | 36,4 | 24,9 | 31,8 | 0,0 | 396 |
| Poshekhonsky cheese | 41,0 | 26,0 | 26,5 | 0,0 | 334 |
| Processed cheese | 55,0 | 24,0 | 13,5 | 0,0 | 226 |
| Fat cottage cheese | 64,7 | 14,0 | 18,0 | 1,3 | 226 |
| Cottage cheese 9% fat | 71,0 | 16,7 | 9,0 | 1,3 | 156 |
| Low-fat cottage cheese | 77,7 | 18,0 | 0,6 | 1,5 | 86 |
Table 1. Protein content in animal products
| Products | Proteins, g/100 g (product) |
| Meat, offal, sausages | |
| Beef 1st category | 18,6 |
| Beef 2nd category | 20 |
| Lamb (1st category) | 15,6 |
| Lamb (2nd category) | 19,8 |
| Pork (meat) | 14,3 |
| Pork (fat) | 11,7 |
| Veal | 19,7 |
| horsemeat | 19,5 |
| Rabbit meat | 21,1 |
| Beef liver, kidneys | 17,9 |
| Beef heart | 16 |
| Light beef | 15,2 |
| Beef tongue | 14 |
| Pork liver | 19 |
| Pork kidneys | 13 |
| Pork heart, lung | 15 |
| Pork tongue | 14 |
| Milk sausages | 11,4 |
| Doctor's sausage | 12,8 |
| Amateur sausage | 12,2 |
| Semi-smoked sausage | 16,5 |
| Ham | 22,6 |
| Raw smoked loin | 10,5 |
| Beef stew | 16 |
| Stewed pork | 15 |
| Sausage mince | 15,2 |
| Liver pate | 11 |
| Bird, eggs | |
| Chickens (1st category) | 18,2 |
| Chickens (2nd category) | 20,8 |
| Chicken egg | 12,7 |
| Goose | 15,2 |
| Turkey | 19,5 |
| Duck | 15,8 |
| Fish, seafood | |
| Chum salmon | 22 |
| Pink salmon | 21 |
| Herring | 19 |
| Burbot | 18,8 |
| Horse mackerel | 18,5 |
| Mackerel | 18 |
| Sea bass | 18,3 |
| Crucian carp, pike, river perch | 17,7 |
| Bream | 17,1 |
| Hake | 16,7 |
| Navaga | 16,1 |
| Flounder | 16,1 |
| Carp | 16 |
| Cod | 16 |
| Pollock | 15,9 |
| capelin | 13,4 |
| Squid | 18 |
| Shrimp | 18 |
| Crab | 16 |
| Chum salmon caviar (grainy) | 31,6 |
| Sturgeon caviar (grainy) | 28,9 |
| Pollock caviar | 28,4 |
| Cod liver | 4,2 |
| Dairy | |
| Cow's milk (pasteurized) | 2,8 |
| Protein milk | 4,3 |
| Condensed milk (with sugar) | 7,2 |
| Powdered milk | 25,6 |
| Kefir (fat) | 2,8 |
| Kefir (low-fat) | 3 |
| Curdled milk | 2,8 |
| Ryazhenka | 3 |
| Yogurt (1.5%) | 5 |
| Sour cream (20%) | 2,8 |
| Cream (10%) | 3 |
| Cream (20%) | 2,8 |
| Cream (dry) | 23 |
| Cottage cheese (fat) | 14 |
| Cottage cheese (bold) | 16,7 |
| Cottage cheese (low fat) | 18 |
| Cheeses and curd masses | 7,1 |
| Cheese (Dutch) | 26,8 |
| Cheese (Poshekhonsky) | 26 |
| Cheese (Swiss) | 24,9 |
| Cheese (Russian) | 23,4 |
| Cheese (processed) | 24 |
| Brynza | 17,9 |
| Butter | 0,6 |
| Ice cream | 3,3 |
| Margarine | 0,3 |
Bakery products, flour
| Product | Water, g | Proteins, g | Fats, g | Carbohydrates, g | Calorie content, kcal per 100 g |
| Rye bread | 42,4 | 4,7 | 0,7 | 49,8 | 214 |
| Wheat bread from grade I flour | 34,3 | 7,7 | 2,4 | 53,4 | 254 |
| Butter pastries | 26,1 | 7,6 | 4,5 | 60,0 | 297 |
| Baranki | 17,0 | 10,4 | 1,3 | 68,7 | 312 |
| Drying | 12,0 | 11,0 | 1,3 | 73,0 | 330 |
| Wheat crackers | 12,0 | 11,2 | 1,4 | 72,4 | 331 |
| Cream crackers | 8,0 | 8,5 | 10,6 | 71,3 | 397 |
| Premium wheat flour | 14,0 | 10,3 | 0,9 | 74,2 | 327 |
| Wheat flour, grade I | 14,0 | 10,6 | 1,3 | 73,2 | 329 |
| Wheat flour, grade II | 14,0 | 11,7 | 1,8 | 70,8 | 328 |
| Rye flour | 14,0 | 6,9 | 1,1 | 76,9 | 326 |
Cereals
| Product | Water, g | Proteins, g | Fats, g | Carbohydrates, g | Calorie content, kcal per 100 g |
| Buckwheat core | 14,0 | 12,6 | 2,6 | 68,0 | 329 |
| Buckwheat done | 14,0 | 9,5 | 1,9 | 72,2 | 326 |
| Manna | 14,0 | 11,3 | 0,7 | 73,3 | 326 |
| Oatmeal | 12,0 | 11,9 | 5,8 | 65,4 | 345 |
| Pearl barley | 14,0 | 9,3 | 1,1 | 73,7 | 324 |
| Millet | 14,0 | 12,0 | 2,9 | 69,3 | 334 |
| Rice | 14,0 | 7,0 | 0,6 | 73,7 | 323 |
| Wheat “Poltavskaya” | 14,0 | 12,7 | 1,1 | 70,6 | 325 |
| Oatmeal | 10,0 | 12,2 | 5,8 | 68,3 | 357 |
| Barley | 14,0 | 10,4 | 1,3 | 71,7 | 322 |
| Hercules | 12,0 | 13,1 | 6,2 | 65,7 | 355 |
| Corn | 14,0 | 8,3 | 1,2 | 75,0 | 325 |
Vegetables
| Product | Water, g | Proteins, g | Fats, g | Carbohydrates, g | Calorie content, kcal per 100 g |
| Eggplant | 91,0 | 0,6 | 0,1 | 5,5 | 24 |
| Swede | 87,5 | 1,2 | 0,1 | 8,1 | 37 |
| Green peas | 80,0 | 5,0 | 0,2 | 13,3 | 72 |
| Zucchini | 93,0 | 0,6 | 0,3 | 5,7 | 27 |
| White cabbage | 90,0 | 1,8 | – | 5,4 | 28 |
| Red cabbage | 90,0 | 1,8 | – | 6,1 | 31 |
| Cauliflower | 90,9 | 2,5 | – | 4,9 | 29 |
| Potato | 76,0 | 2,0 | 0,1 | 19,7 | 83 |
| Green onion (feather) | 92,5 | 1,3 | – | 4,3 | 22 |
| Leek | 87,0 | 3,0 | – | 7,3 | 40 |
| Bulb onions | 86,0 | 1,7 | – | 9,5 | 43 |
| Red carrots | 88,5 | 1,3 | 0,1 | 7,0 | 33 |
| Ground cucumbers | 95,0 | 0,8 | – | 3,0 | 15 |
| Greenhouse cucumbers | 96,5 | 0,7 | – | 1,8 | 10 |
| Sweet green pepper | 92,0 | 1,3 | – | 4,7 | 23 |
| Sweet red pepper | 91,0 | 1,3 | – | 5,7 | 27 |
| Parsley (greens) | 85,0 | 3,7 | – | 8,1 | 45 |
| Parsley (root) | 85,0 | 1,5 | – | 11,0 | 47 |
| Rhubarb (petiole) | 94,5 | 0,7 | – | 2,9 | 16 |
| Radish | 93,0 | 1,2 | – | 4,1 | 20 |
| Radish | 88,6 | 1,9 | – | 7,0 | 34 |
| Turnip | 90,5 | 1,5 | – | 5,9 | 28 |
| Salad | 95,0 | 1,5 | – | 2,2 | 14 |
| Beet | 86,5 | 1,7 | – | 10,8 | 48 |
| Tomatoes (ground) | 93,5 | 0,6 | – | 4,2 | 19 |
| Tomatoes (greenhouse) | 94,6 | 0,6 | – | 2,9 | 14 |
| Green beans (pod) | 90,0 | 4,0 | – | 4,3 | 32 |
| Horseradish | 77,0 | 2,5 | – | 16,3 | 71 |
| Cheremsha | 89,0 | 2,4 | – | 6,5 | 34 |
| Garlic | 70,0 | 6,5 | – | 21,2 | 106 |
| Spinach | 91,2 | 2,9 | – | 2,3 | 21 |
| Sorrel | 90,0 | 1,5 | – | 5,3 | 28 |
Table 2. Protein content in foods of plant origin
| Products | Proteins, g/100 g (product) |
| Legumes, nuts, seeds | |
| Soybeans | 34,9 |
| Lentils | 24,8 |
| Peas | 23 |
| Beans | 22,3 |
| Pumpkin seeds | 30,2 |
| Peanut | 26,3 |
| Sunflower seeds | 20,8 |
| Almond | 18,6 |
| Cashew | 18,2 |
| Pistachios | 20,3 |
| Hazelnut | 16,1 |
| Brazilian nut | 14,3 |
| Walnut | 13,6 |
| Cereals, bakery and pasta products | |
| Hercules | 13,1 |
| Poltava groats | 12,7 |
| Buckwheat | 12,6 |
| Millet | 12,1 |
| Oat groats | 11,9 |
| Semolina | 11,3 |
| Pearl barley | 10,4 |
| Barley groats | 9,5 |
| Barley grits | 9,3 |
| Corn grits | 8,3 |
| Rice cereal | 7 |
| Wheat bread (from 1st grade flour) | 7,6 |
| Wheat bread (from 2nd grade flour) | 8,4 |
| Rye bread | 5,5 |
| Pasta (egg) | 11,3 |
| Pasta (1st grade) | 10,7 |
| Pasta (highest grade) | 10,4 |
| Vegetables, mushrooms, dried fruits | |
| Potato | 2 |
| Beet | 1,5-2,5 |
| Brussels sprouts | 4,8 |
| Karusta kohlrabi | 2,8 |
| Cauliflower | 2,5 |
| White cabbage | 1,8 |
| Garlic | 6,5 |
| Spinach | 2,9 |
| Radish | 1,9 |
| Turnip | 1,5 |
| Carrot | 1,4 |
| Pepper (red sweet) | 1,3 |
| Pepper (green sweet) | 1,3 |
| Eggplant | 1,2 |
| Mushrooms (white) | 3,7 |
| Champignon | 4,3 |
| Dried apricots | 5,3 |
| Dates | 2,5 |
| Prunes | 2,3 |
| Raisin | 1,9 |
It is worth noting that in one meal our body can absorb no more than 30 g of protein. In addition, the degree of absorption of different proteins varies greatly.
It depends both on the type of protein (animal or plant), and on the method of processing food, and the general condition of the body. Animal proteins are digested by approximately 70-90%. Vegetable - by 40-70%.
Here are some examples:
- Chicken egg whites - degree of absorption 92-100%;
- Proteins of fermented milk - up to 90%;
- Fresh milk proteins - 83%;
- Beef proteins - 76%;
- Cottage cheese proteins - 75%;
- Oatmeal proteins - 66%;
- Proteins of products made from wheat flour - 52%.
Fruits and berries
| Product | Water, g | Proteins, g | Fats, g | Carbohydrates, g | Calorie content, kcal per 100 g |
| Apricots | 86,0 | 0,9 | – | 10,5 | 46 |
| Quince | 87,5 | 0,6 | – | 8,9 | 38 |
| Cherry plum | 89,0 | 0,2 | – | 7,4 | 34 |
| A pineapple | 86,0 | 0,4 | – | 11,8 | 48 |
| Bananas | 74,0 | 1,5 | – | 22,4 | 91 |
| Cherry | 85,5 | 0,8 | – | 11,3 | 49 |
| Pomegranate | 85,0 | 0,9 | – | 11,8 | 52 |
| Pear | 87,5 | 0,4 | – | 10,7 | 42 |
| Figs | 83,0 | 0,7 | – | 13,9 | 56 |
| Dogwood | 85,0 | 1,0 | – | 9,7 | 45 |
| Peaches | 86,5 | 0,9 | – | 10,4 | 44 |
| Rowan garden | 81,0 | 1,4 | – | 12,5 | 58 |
| Rowan chokeberry | 80,5 | 1,5 | – | 12,0 | 54 |
| Garden plum | 87,0 | 0,8 | – | 9,9 | 43 |
| Dates | 20,0 | 2,5 | – | 72,1 | 281 |
| Persimmon | 81,5 | 0,5 | – | 15,9 | 62 |
| Cherries | 85,0 | 1,1 | – | 12,3 | 52 |
| Mulberry | 82,7 | 0,7 | – | 12,7 | 53 |
| Apples | 86,5 | 0,4 | – | 11,3 | 46 |
| Orange | 87,5 | 0,9 | – | 8,4 | 38 |
| Grapefruit | 89,0 | 0,9 | – | 7,3 | 35 |
| Lemon | 87,7 | 0,9 | – | 3,6 | 31 |
| Mandarin | 88,5 | 0,8 | – | 8,6 | 38 |
| Cowberry | 87,0 | 0,7 | – | 8,6 | 40 |
| Grape | 80,2 | 0,4 | – | 17,5 | 69 |
| Blueberry | 88,2 | 1,0 | – | 7,7 | 37 |
| Blackberry | 88,0 | 2,0 | – | 5,3 | 33 |
| Strawberries | 84,5 | 1,8 | – | 8,1 | 41 |
| Cranberry | 89,5 | 0,5 | – | 4,8 | 28 |
| Gooseberry | 85,0 | 0,7 | – | 9,9 | 44 |
| Raspberries | 87,0 | 0,8 | – | 9,0 | 41 |
| Cloudberry | 83,3 | 0,8 | – | 6,8 | 31 |
| Sea buckthorn | 75,0 | 0,9 | – | 5,5 | 30 |
| White currant | 86,0 | 0,3 | – | 8,7 | 39 |
| Red currants | 85,4 | 0,6 | – | 8,0 | 38 |
| Black currant | 85,0 | 1,0 | – | 8,0 | 40 |
| Blueberry | 86,5 | 1,1 | – | 8,6 | 40 |
| Fresh rosehip | 66,0 | 1,6 | – | 24,0 | 101 |
| Dried rose hips | 14,0 | 4,0 | – | 60,0 | 253 |
Dried fruits
| Product | Water, g | Proteins, g | Fats, g | Carbohydrates, g | Calorie content, kcal per 100 g |
| Dried apricots | 18,0 | 5,0 | – | 67,5 | 278 |
| Dried apricots | 20,2 | 5,2 | – | 65,9 | 272 |
| Raisins with pit | 19,0 | 1,8 | – | 70,9 | 276 |
| Raisins sultanas | 18,0 | 2,3 | – | 71,2 | 279 |
| Cherry | 18,0 | 1,5 | – | 73,0 | 292 |
| Pear | 24,0 | 2,3 | – | 62,1 | 246 |
| Peaches | 18,0 | 3,0 | – | 68,5 | 275 |
| Prunes | 25,0 | 2,3 | – | 65,6 | 264 |
| Apples | 20,0 | 3,2 | – | 68,0 | 273 |
Legumes
| Product | Water, g | Proteins, g | Fats, g | Carbohydrates, g | Calorie content, kcal per 100 g |
| Beans | 83,0 | 6,0 | 0,1 | 8,3 | 58 |
| Peas | 14,0 | 23,0 | 1,6 | 57,7 | 323 |
| Whole peas | 14,0 | 23,0 | 1,2 | 53,3 | 303 |
| Soybeans | 12,0 | 34,9 | 17,3 | 26,5 | 395 |
| Beans | 14,0 | 22,3 | 1,7 | 54,5 | 309 |
| Lentils | 14,0 | 24,8 | 1,1 | 53,7 | 310 |
Protein content in food products (table)
Proteins can be of animal or plant origin.
Most plant proteins (such as whole grains) are incomplete at 40%. Animal proteins (meat, fish, poultry, dairy products, eggs), as well as some plant proteins (soybeans, beans, peas), are complete and should make up 60% of the total protein per day.
Below is a table of animal and plant foods rich in proteins.
Eggs
| Product | Water, g | Proteins, g | Fats, g | Carbohydrates, g | Calorie content, kcal per 100 g |
| Chicken egg | 74,0 | 12,7 | 11,5 | 0,7 | 157 |
| Egg powder | 6,8 | 45 | 37,3 | 7,1 | 542 |
| Protein powder | 12,1 | 73,3 | 1,8 | 7 | 336 |
| Dry yolk | 5,4 | 34,2 | 52,2 | 4,4 | 623 |
| Quail egg | 73,3 | 11,9 | 13,1 | 0,6 | 168 |
Foods high in plant protein (vegetables and fruits)
Among vegetables, broccoli is the richest in protein. There are 3 grams of vegetable protein per .
Baked broccoli
The nutritional value of broccoli is 30 kcal per 100 g . Eating broccoli promotes the death of cancer cells. A unique vitamin and mineral composition, including iodine, phosphorus, chromium, fills the body with energy and lightness.
Broccoli is an easy dietary vegetable that promotes digestion and rejuvenation of blood vessels.
Brussels sprouts
Almost the same amount of protein is found in Brussels sprouts. Broccoli is a little higher in calories, but it still belongs to dietary products. Brussels sprouts improve heart function and are rich in folic acid, which is so necessary for the structure and functioning of the nervous system.
Smoothie
A great way to get your daily dose of nutrients quickly and easily. You can easily prepare such a drink at home and it will contain everything you need: protein, healthy fats, vegetables and fruits.
Fish and seafood
| Product | Water, g | Proteins, g | Fats, g | Carbohydrates, g | Calorie content, kcal per 100 g |
| Gobies | 70,8 | 12,8 | 8,1 | 5,2 | 145 |
| Pink salmon | 70,5 | 21 | 7 | 0 | 147 |
| Flounder | 79,5 | 16,1 | 2,6 | 0 | 88 |
| crucian carp | 78,9 | 17,7 | 1,8 | 0 | 87 |
| Carp | 79.1 | 16 | 3.6 | 0 | 96 |
| Chum salmon | 71.3 | 22 | 5.6 | 0 | 138 |
| Smelt | 79.8 | 15.5 | 3.2 | 0 | 91 |
| Icy | 81.8 | 15.5 | 1.4 | 0 | 75 |
| Bream | 77.7 | 17.1 | 4.1 | 0 | 105 |
| Salmon | 62.9 | 20.8 | 15.1 | 0 | 219 |
| Macrurus | 85 | 13.2 | 0.8 | 0 | 60 |
| Lamprey | 75 | 14.7 | 11.9 | 0 | 166 |
| Pollock | 80.1 | 15.9 | 0.7 | 0 | 70 |
| capelin | 75 | 13.4 | 11.5 | 0 | 157 |
| Navaga | 81.1 | 16.1 | 1 | 0 | 73 |
| Burbot | 79.3 | 18.8 | 0.6 | 0 | 81 |
| Marbled notothenia | 73.4 | 14.8 | 10.7 | 0 | 156 |
| Sea bass | 75.4 | 17.6 | 5.2 | 0 | 117 |
| River perch | 79.2 | 18.5 | 0.9 | 0 | 82 |
| Sturgeon | 71.4 | 16.4 | 10.9 | 0 | 164 |
| Halibut | 76.9 | 18.9 | 3 | 0 | 103 |
| Blue whiting | 81.3 | 16.1 | 0.9 | 0 | 72 |
| Saber fish | 75.2 | 20.3 | 3.2 | 0 | 110 |
| Caspian fisherman | 77 | 19.2 | 2.4 | 0 | 98 |
| Carp | 75.3 | 18.4 | 5.3 | 0 | 121 |
| Large saury | 59.8 | 18.6 | 20.8 | 0 | 262 |
| Small saury | 71.3 | 20.4 | 0.8 | 0 | 143 |
| Salaka | 75.4 | 17.3 | 5.6 | 0 | 121 |
| Herring | 62.7 | 17.7 | 19.5 | 0 | 242 |
| Whitefish | 72.3 | 19 | 7.5 | 0 | 144 |
| Mackerel | 71.8 | 18 | 9 | 0 | 153 |
| Som | 75 | 16.8 | 8.5 | 0 | 144 |
| Horse mackerel | 74.9 | 18.5 | 5 | 0 | 119 |
| Sterlet | 74.9 | 17 | 6.1 | 0 | 320 |
| Zander | 78.9 | 19 | 0.8 | 0 | 83 |
| Cod | 80.7 | 17.5 | 0.6 | 0 | 75 |
| Tuna | 74 | 22,7 | 0,7 | 0 | 96 |
| coal fish | 71.5 | 13.2 | 11.6 | 0 | 158 |
| Sea eel | 77.5 | 19.1 | 1.9 | 0 | 94 |
| Acne | 53.5 | 14.5 | 30.5 | 0 | 333 |
| Hake | 79.9 | 16.6 | 2.2 | 0 | 86 |
| Pike | 70.4 | 18.8 | 0.7 | 0 | 82 |
| Ide | 80.1 | 18.2 | 0.3 | 0 | 117 |
| Far Eastern shrimp | 64,8 | 28,7 | 1,2 | 0 | 134 |
| Cod liver | 26,4 | 4,2 | 65,7 | 0 | 613 |
| Squid | 80,3 | 18 | 0,3 | 0 | 75 |
| Crab | 81,5 | 16 | 0,5 | 0 | 69 |
| Shrimp | 77,5 | 18 | 0,8 | 0 | 83 |
| Sea kale | 88 | 0,9 | 0,2 | 3,0 | 5 |
| Pasta “Ocean” | 72,2 | 18,9 | 6,8 | 0 | 137 |
| Trepang | 89,4 | 7,3 | 0,6 | 0 | 35 |
How much protein do different foods contain?
Food products of animal origin contain the largest amount of protein. Animal proteins are complete, as they contain a full range of essential amino acids.
Plant products contain incomplete protein, which lacks 1-2 amino acids. A deficiency of these micronutrients can lead to improper functioning of the body. For this reason, it is important for vegetarians to plan their menu correctly.
High-protein products containing protein of the first and second types are presented in the tables. For the convenience of including them in the diet, data on the content of fats and carbohydrates in them is also given.
Table: amount of protein in meat
Meat products are one of the main sources of complete protein:
Meat is the richest product in complete proteins. Table of contents per 100 g. below
| Name | Protein g/100 g | Fats g/100 g | Carbohydrates g/100 g |
| Beef | 23 | 12,4 | 0 |
| Lean lamb | 20 | 7,2 | 0 |
| Fatty lamb | 15 | 16,3 | 0 |
| Lean veal | 23 | 2,5 | 0 |
| Lean pork | 19 | 7,1 | 0 |
| Pork is fatty | 12 | 45,1 | 1,09 |
| Venison | 20 | 8,5 | 0 |
| Rabbit | 21 | 8 | 0 |
| Chicken | 23 | 1,2 | 0 |
| Turkey | 23 | 0,7 | 0 |
Table: proteins in fish and seafood
Fish and seafood also help saturate the body with high-quality protein.
The table shows the nutritional value of the main types of fish and seafood:
| Name | Protein g/100 g | Fats g/100 g | Carbohydrates g/100 g |
| Tuna | 24,4 | 1 | 0 |
| Salmon | 20 | 6,3 | 0 |
| Mackerel | 18 | 13,6 | 0,6 |
| Flounder | 16 | 1,8 | 0 |
| Pink salmon | 21 | 6,5 | 0 |
| capelin | 13,4 | 11,5 | 0 |
| Herring | 17,7 | 10,7 | 0 |
| Zander | 19 | 0,7 | 0 |
| Cod | 17,7 | 0,7 | 0 |
| Sturgeon | 16,4 | 10,9 | 0 |
| Pollock | 16 | 1 | 0 |
| Bream | 17 | 4 | 0 |
| Salmon | 21,6 | 6 | 0 |
| Trout | 19 | 2,1 | 0 |
| Squid | 18 | 2,8 | 2 |
| Crab | 16,4 | 1,7 | 4,2 |
| Shrimps | 20,6 | 2,2 | 0 |
Table: proteins in dairy products
Dairy products are an additional source of protein. When including them in your diet, you must take into account that they contain carbohydrates, unlike meat or fish.
| Product name | Protein g/100 g | Fats g/100 g | Carbohydrates g/100 g |
| Cottage cheese | 14-18 | 1-11 | 1-3 |
| Milk | 3 | 3,5 | 6 |
| Sour cream | 3 | 17 | 4 |
| Kefir | 9,8 | 3,3 | 13,3 |
| Yogurt | 4,4 | 2,9 | 6,3 |
| Cream | 2,2 | 33 | 4 |
| Cheese | 23-29 | 29,5 | 0,3 |
Table: proteins in cereals
Protein-rich foods, a table with a list of which is given later in the article, are a source of vegetable protein. They form an important part of the vegetarian diet, along with eggs and dairy products (if these are not excluded).
| Name of cereal | Protein g/100 g | Fats g/100 g | Carbohydrates g/100 g |
| Wild rice | 14 | 0,7 | 52 |
| Quinoa | 14 | 6 | 57 |
| Couscous | 12,8 | 0,6 | 72 |
| Buckwheat | 12,6 | 3,3 | 62 |
| Oatmeal | 12 | 7,2 | 69 |
| White rice | 7 | 0,7 | 79 |
| Pearl barley | 9,3 | 1,1 | 74 |
| Pshenka | 11,5 | 3,3 | 69 |
| Semolina | 10 | 1 | 67 |
| Hercules | 13 | 5,9 | 54 |
Caviar
| Product | Water, g | Proteins, g | Fats, g | Carbohydrates, g | Calorie content, kcal per 100 g |
| Chum salmon granular | 46,9 | 31,6 | 13,8 | 0 | 251 |
| Bream punch | 58 | 24,7 | 4,8 | 0 | 142 |
| Pollock punch | 63,2 | 28,4 | 1,9 | 0 | 131 |
| Sturgeon granular | 58 | 28,9 | 9,7 | 0 | 203 |
| Sturgeon punch | 39,5 | 36 | 10,2 | 0 | 123 |
Calories in foods
The energy contained in food products is of greatest interest. In production, their exact value is measured in a special device, a calorimeter, by burning it in a sealed chamber. The amount of heat released during this process is the energy value. This is how the manufacturer determines how many calories are in the food. To inform buyers, this value is applied to the packaging in which the product will be sold. The number of calories in foods is usually indicated per 100 grams of weight.
We recommend reading: Dried fruits: benefits or harm
Fats, margarine, butter
| Product | Water, g | Proteins, g | Fats, g | Carbohydrates, g | Calorie content, kcal per 100 g |
| Rendered lamb or beef fat | 0,3 | 0 | 99,7 | 0 | 897 |
| Pork bacon (without skin) | 5,7 | 1,4 | 92,8 | 0 | 816 |
| Milk margarine | 15,9 | 0,3 | 82,3 | 1 | 746 |
| Sandwich margarine | 15,8 | 0,5 | 82 | 1,2 | 744 |
| Mayonnaise | 25 | 3,1 | 67 | 2,6 | 627 |
| Vegetable oil | 0,1 | 0 | 99,9 | 0 | 899 |
| Butter | 15,8 | 0,6 | 82,5 | 0,9 | 748 |
| Ghee | 1 | 0,3 | 98 | 0,6 | 887 |
Meat, poultry
| Product | Water, g | Proteins, g | Fats, g | Carbohydrates, g | Calorie content, kcal per 100 g |
| Mutton | 67,6 | 16,3 | 15,3 | 0,0 | 203 |
| Beef | 67,7 | 18,9 | 12,4 | 0,0 | 187 |
| horsemeat | 72,5 | 20,2 | 7,0 | 0,0 | 143 |
| Rabbit | 65,3 | 20,7 | 12,9 | 0,0 | 199 |
| Pork lean | 54,8 | 16,4 | 27,8 | 0,0 | 316 |
| Pork is fatty | 38,7 | 11,4 | 49,3 | 0,0 | 489 |
| Veal | 78,0 | 19,7 | 1,2 | 0,0 | 90 |
| Lamb Kidneys | 79,7 | 13,6 | 2,5 | 0,0 | 77 |
| Lamb Liver | 71,2 | 18,7 | 2,9 | 0,0 | 101 |
| Lamb Heart | 78,5 | 13,5 | 2,5 | 0,0 | 82 |
| Beef Brains | 78,9 | 9,5 | 9,5 | 0,0 | 124 |
| Beef liver | 72,9 | 17,4 | 3,1 | 0,0 | 98 |
| Beef Kidneys | 82,7 | 12,5 | 1,8 | 0,0 | 66 |
| Beef Udder | 72,6 | 12,3 | 13,7 | 0,0 | 173 |
| Beef Heart | 79,0 | 15,0 | 3,0 | 0,0 | 87 |
| Beef Tongue | 71,2 | 13,6 | 12,1 | 0,0 | 163 |
| Pork kidneys | 80,1 | 13,0 | 3,1 | 0,0 | 80 |
| Pork liver | 71,4 | 18,8 | 3,6 | 0,0 | 108 |
| Pig heart | 78,0 | 15,1 | 3,2 | 0,0 | 89 |
| Pig tongue | 66,1 | 14,2 | 16,8 | 0,0 | 208 |
| Geese | 49,7 | 16,1 | 33,3 | 0,0 | 364 |
| Turkey | 64,5 | 21,6 | 12,0 | 0,8 | 197 |
| Chickens | 68,9 | 20,8 | 8,8 | 0,6 | 165 |
| Chickens | 71,3 | 18,7 | 7,8 | 0,4 | 156 |
| Ducks | 51,5 | 16,5 | 61,2 | 0,0 | 346 |
Foods high in animal protein
The well-known chicken eggs are inferior in the amount of protein per weight to meat products. But chicken egg white does not contain any fat or carbohydrates; it is pure protein. Chicken eggs are affordable, easy to prepare, and contain vitamins and minerals.
Eating eggs helps strengthen the immune system, maintains normal vision, and has bactericidal properties. Egg white contains substances necessary for hematopoiesis and brain function. This product is absorbed by 97-98 (%). This figure is the highest among animal products. And in terms of nutritional value, the egg will give a head start to milk and meat.
100 grams of chicken egg contains 12.7 g of protein and 157 kcal .
Chicken breast
One of the most favorite products of athletes and adherents of proper nutrition. This ratio is justified by the high protein content, more than 24 g per 100 g of meat, combined with a low fat content, less than 8 g per 100 g of meat, and a relatively low calorie content, 130 kcal .
Chicken breast contains many vitamins necessary for the functioning of brain cells, the nervous system, and the digestive system. The composition of minerals is rich and varied, thanks to which chicken breast promotes recovery from injuries and illnesses, increases immunity, and ensures proper functioning of the heart muscle.
This product is easily digestible, and there are a huge number of options for preparing delicious dishes from it.
Turkey breast
Turkey meat is lower in calories than chicken. Its energy value is 84 kcal per 100 g , and the amount of protein is 19.2 g . The minimum fat content, 0.7 g per 100 g of product, allows you to get rid of excess weight by reducing fat, but not muscle mass. The product is ideal for bodybuilders and athletes.
Turkey breast is a dietary product. Turkey meat has a positive effect on metabolic processes. The almost complete composition of B vitamins contributes to the normalization of the nervous system. Containing a large amount of selenium supports the functioning of hormonal levels.
Red meat
Beef meat is rich in protein content. 16 grams of this macronutrient is combined with 150 kcal per 100 g of product.
In addition, red meat contains iron, which is necessary to supply oxygen to all organs of the human body. The high zinc content enhances protective functions and helps in the fight against viruses. Vitamins B3 and B12 are involved in the functioning of all organs and systems in our body.
To obtain maximum benefits and eliminate harmful effects, you should choose lean meat and eat it boiled or stewed. Steamed lean beef products are also beneficial.
Jerky
In the line of protein products, dried meat (basturma, jamon) occupies a special place, the benefit of which lies in its naturalness. But due to the high salt content, it is contraindicated for people with excess body weight and joint diseases.
100 g of product contains 55.7 g of protein.
| 100 grams of product | Squirrels | Fats | Kcal |
| Boiled beef | 25 | 16 | 254 |
| Boiled veal | 30.7 | 0.9 | 131 |
| Pork | 11-16.4 | 27.8-49 | 316-489 |
| Mutton | 24.6 | 21.4 | 291 |
| horsemeat | 20.2 | 7 | 187 |
| Chicken | 10-21 | 2-16 | 139-195 |
| Beef liver | 20 | 3 | 125 |
| Boiled beef tongue | 12 | 10 | 146 |
| Pork tongue | 16 | 11 | 165 |
| Calf tongue | 13 | 23 | 160 |
Sausages
| Product | Water, g | Proteins, g | Fats, g | Carbohydrates, g | Calorie content, kcal per 100 g |
| Boiled sausage Diabetic | 62,4 | 12,1 | 22,8 | 0 | 254 |
| Boiled sausage Dietary | 71,6 | 12,1 | 13,5 | 0 | 170 |
| Boiled sausage Doctorskaya | 60,8 | 13,7 | 22,8 | 0 | 260 |
| Boiled sausage Lyubitelskaya | 57,0 | 12,2 | 28,0 | 0 | 301 |
| Boiled sausage Milk | 62,8 | 11,7 | 22,8 | 0 | 252 |
| Boiled sausage Separate | 64,8 | 10,1 | 20,1 | 1,8 | 228 |
| Boiled veal sausage | 55,0 | 12,5 | 29,6 | 0 | 316 |
| Pork sausages | 53,7 | 10,1 | 31,6 | 1,9 | 332 |
| Dairy sausages | 60,0 | 12,3 | 25,3 | 0 | 277 |
| Russian sausages | 66,2 | 12,0 | 19,1 | 0 | 220 |
| Pork sausages | 54,8 | 11,8 | 30,8 | 0 | 324 |
| Boiled-smoked Amateur | 39,1 | 17,3 | 39,0 | 0 | 420 |
| Boiled-smoked Cervelat | 39,6 | 28,2 | 27,5 | 0 | 360 |
| Semi-smoked Krakow | 34,6 | 16,2 | 44,6 | 0 | 466 |
| Semi-smoked Minsk | 52,0 | 23,0 | 17,4 | 2,7 | 259 |
| Semi-smoked Poltavskaya | 39,8 | 16,4 | 39,0 | 0 | 417 |
| Semi-smoked Ukrainian | 44,4 | 16,5 | 34,4 | 0 | 376 |
| Raw smoked Amateur | 25,2 | 20,9 | 47,8 | 0 | 514 |
| Raw smoked Moscow | 27,6 | 24,8 | 41,5 | 0 | 473 |
Canned meat and smoked meats
| Product | Water, g | Proteins, g | Fats, g | Carbohydrates, g | Calorie content, kcal per 100 g |
| Beef stew | 63,0 | 16,8 | 18,3 | 0 | 232 |
| Tourist breakfast (beef) | 66,9 | 20,5 | 10,4 | 0 | 176 |
| Tourist breakfast (pork) | 65,6 | 16,9 | 15,4 | 0 | 206 |
| Sausage mince | 63,2 | 15,2 | 15,7 | 2,8 | 213 |
| Pork stew | 51,1 | 14,9 | 32,2 | 0 | 349 |
| Raw smoked brisket | 21,0 | 7,6 | 66,8 | 0 | 632 |
| Raw smoked loin | 37,3 | 10,5 | 47,2 | 0 | 467 |
| Ham | 53,5 | 22,6 | 20,9 | 0 | 279 |
Nutritional value and chemical composition of turkey meat
% of the daily requirement indicated in the tables is an indicator indicating how many percent of the daily requirement in a substance we will satisfy the body's needs by eating 100 grams of turkey.
How much protein, fat and carbohydrates (BJC) are in turkey?
Turkey meat is a relatively inexpensive source of protein. It has 1g more protein than chicken and beef. At the same time, turkey meat is low in fat and cholesterol, unlike other types of meat.
What vitamins, macro- and microelements are contained in turkey?
Turkey meat is effective in increasing thyroid hormones
, preventing various types of cancer, strengthening the immune system and providing antioxidant substances. Turkey meat is beneficial in reducing bad cholesterol, increasing good cholesterol, increasing energy production, improving mood, increasing testosterone levels and maintaining healthy blood pressure.
Let's sum it up
Compared to other types of meat, turkey contains fewer calories, less fat, less cholesterol, very little sodium, but is high in protein, vitamins and minerals.
Turkey meat is a valuable source of protein
and other nutrients.
For a healthy diet, it is important to choose the right cut of meat and also eat the right portion sizes. Nutritionists recommend eating 65 to 100 grams
of boiled meat. Each serving provides the daily requirement of proteins, which are very important for the production of various types of amino acids in the human body.
In what form do you like to cook turkey: soup, salad, cutlets, shish kebab or another favorite dish? When choosing between turkey and chicken, which meat will you choose? The best news is that turkey meat is so healthy that pediatricians recommend using turkey for the first feeding.
Turkey meat, a poultry that came to us from the Western Hemisphere, is one of the dietary types of meat.
Poultry meat received this definition due to its beneficial properties, the presence of a large number of useful substances, as well as the virtual absence of fat and bad cholesterol.
Turkey meat is rich in amino acids necessary for the proper development of the body and easily digestible protein; meat is prescribed both in therapeutic and in diets for weight loss.
On sale in our stores you can find several varieties of turkey meat, divided into parts of the bird’s body - fillet (breast), wings, thighs, drumsticks, as well as offal (liver, heart).
If a person needs to eat the least high-calorie, fatty foods to create a diet, then turkey meat will be one of the best options for preparing tasty and healthy dishes.
Naturally, each part of the carcass is slightly different in calorie content. Therefore, you need to proceed first of all from the recommendations of a doctor or nutritionist.
- The lowest calorie part of this poultry is considered to be the turkey breast and fillet.
The calorie content of this product without skin is only 84 kcal per 100 grams. - The thigh and drumstick will outpace the breast by a few calories - 144 kcal per hundred grams.
- Wings - up to 191 kcal.
Lower than all its other parts - 84 kcal per 100 grams. This part can be given as a first meat course to small children - no allergies, no harmful substances unnecessary for a growing body.
To avoid inaccurate calculations of calorie content, it is necessary to remove the skin, and also avoid preparing the dish by frying in vegetable oil.
In addition to breast and fillet on a diet, you can use turkey thigh as food, calorie content
which is 144 kcal per hundred grams.
Turkey will be an excellent substitute for chicken, pork or veal meat, especially since it is practically the same in price.
Turkey fillet calories
Naturally, the calorie content of boiled turkey is less than that of fried turkey. This happens because during heat treatment, a certain amount of protein, as well as fat, is released into the water.
In turkey, the skin is considered the fattest part of the carcass - if you separate it from the meat, then almost all the fat remains with the skin. Turkey wings, unfortunately, are not skinned, but when boiled they have slightly fewer calories than when fried.
So, boiled turkey parts have the following number of calories:
- breast – 85 kcal;
- thigh – 145 kcal;
- wings – 150-190 kcal.
The simplest recipe for boiled turkey is preparing boiled fillet.
- You need to cook the fillet for at least an hour and a half, but you shouldn’t overcook it either, otherwise the meat will become tough.
- You can add salt before and during heat treatment, but pepper (if you like it spicy) should be added to the raw product.
- After the cooking process is completed, the sirloin is cut into neat pieces, sprinkled with parsley and served.
- The dish can be eaten both hot and cold – the taste in both forms will be excellent.
Mushrooms
| Product | Water, g | Proteins, g | Fats, g | Carbohydrates, g | Calorie content, kcal per 100 g |
| White fresh | 89,9 | 3,2 | 0,7 | 1,6 | 25 |
| White dried | 13,0 | 27,6 | 6,8 | 10,0 | 209 |
| Fresh boletus | 91,6 | 2,3 | 0,9 | 3,7 | 31 |
| Fresh boletuses | 91,1 | 3,3 | 0,5 | 3,4 | 31 |
| Fresh russula | 83,0 | 1,7 | 0,3 | 1,4 | 17 |
Nuts
| Product | Water, g | Proteins, g | Fats, g | Carbohydrates, g | Calorie content, kcal per 100 g |
| Hazelnut | 4,8 | 16,1 | 66,9 | 9,9 | 704 |
| Almond | 4 | 18,6 | 57,7 | 13,6 | 645 |
| Walnut | 5 | 13,8 | 61,3 | 10,2 | 648 |
| Peanut | 10 | 26,3 | 45,2 | 9,7 | 548 |
| sunflower seed | 8 | 20,7 | 52,9 | 5 | 578 |
Barley
Two types of cereals are obtained from barley grain - pearl barley (this is a whole, but ground and polished grain) and barley (crushed grain). Barley grains contain about 87% starch, which is why they take a long time to cook.
It has been noted that the GI of viscous (thick) cereals is higher than that of semi-liquid ones. Adding milk or butter to pearl barley or barley porridge is undesirable for type 2 diabetes, as this also increases the glycemic index.
Table 1. Dependence of GI on the method of processing and preparation of cereals
